Viewing Options for Performance Monitoring Graphs
The device provides the following options for viewing plotted performance monitoring parameters on graphs:
|
■
|
Viewing a graph in full screen:
|
|
a.
|
In the Navigation pane, select the required KPI Layout (Monitor menu > Monitor tab > Performance Monitoring folder > KPI Layouts > Layouts). |
|
b.
|
Click the hamburger  located in the top-right corner of the graph, and then from the drop-down menu, choose View in full screen. located in the top-right corner of the graph, and then from the drop-down menu, choose View in full screen. |
|
c.
|
To exit full-screen mode, press the Escape key. |
|
■
|
Zooming in and out on graphs:
|
|
a.
|
In the Navigation pane, select the required KPI Layout (Monitor menu > Monitor tab > Performance Monitoring folder > KPI Layouts > Layouts). |
|
b.
|
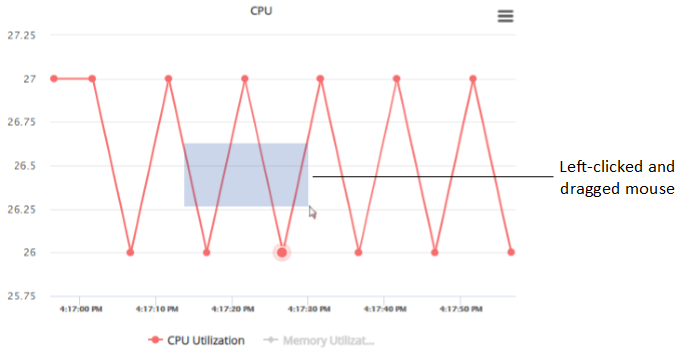
Left-click on the graph and drag the cursor to draw a box around the area into which you would like to zoom. |
|
c.
|
Release the mouse; the display changes to show only the area within the box. |
|
d.
|
To zoom out and return to normal view, click the Reset Zoom button (appears below the hamburger button). |
|
■
|
Showing or hiding plotted performance monitoring parameters in a graph:
|
|
●
|
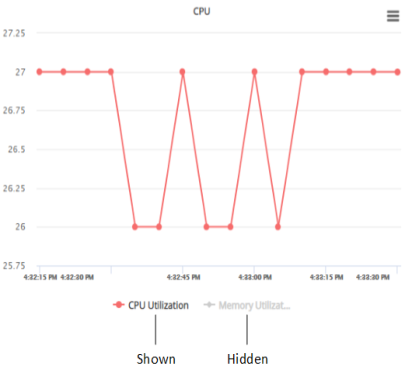
To hide a plotted performance monitoring parameter, click its legend name (located below the graph); the plotted parameter is hidden from the graph and its legend name is grayed out . |
|
●
|
To show a hidden plotted performance monitoring parameter, click its legend name again; the plotted parameter is displayed on the graph and its legend name is in normal font. |